Today we took a quiz on LT #5-7, which you'll get back on Monday. Today we also looked at our first FRAPPY! (Free Response AP Problem . . . Yay!), which we'll go over in detail on Monday. Have a wonderful weekend!
|
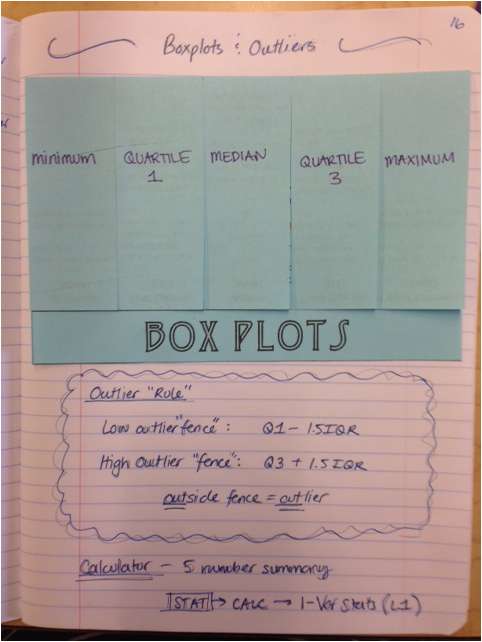
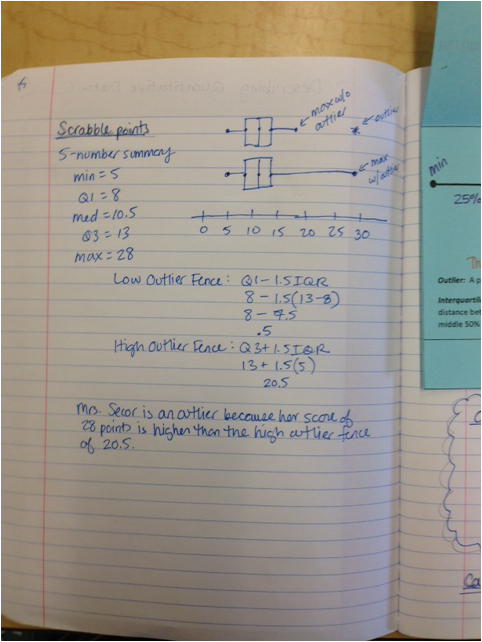
We began today by examining a stemplot of each state's (and D.C.'s) population according to the 2000 U.S. Census. We then created a simple foldable about boxplots and 5-number summaries, which should be a review of work that you did in middle school. Finally, we collected class data on every students' (and Mrs. Secor's!) first name scrabble value. We created a boxplot and found that Mrs. Secor is (obviously) very special and an outlier and therefore superior to you all. Don't forget it. 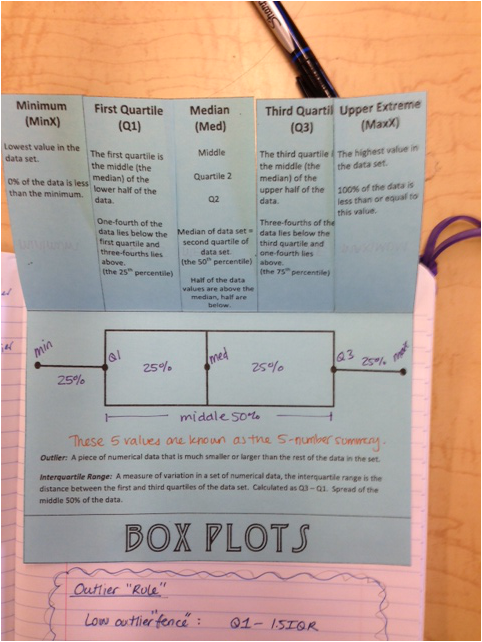
Quiz tomorrow on LT #5-7!!
We practiced describing distributions again today! I know you still feel uncomfortable but you'r
Today we finished up our foldable on describing quantitative distributions... better known as CUSSing. 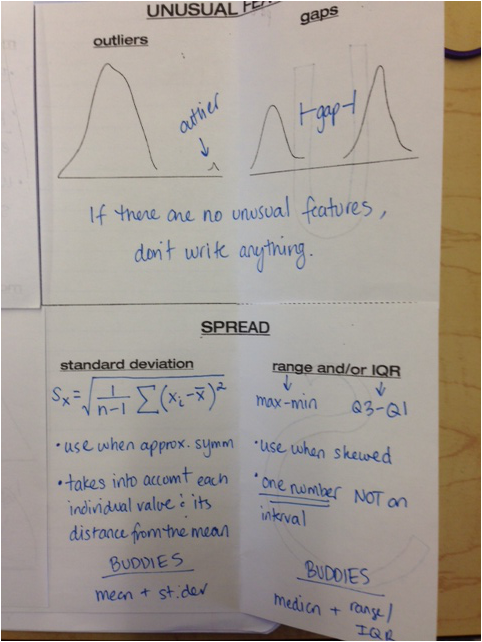
We then worked as a whole class and then in small groups on big whiteboards to practice. We examined each other's work and created practice cards in your ISN's. I know some of you felt frustrated and uncomfortable and that is NORMAL. Statistics is not like your other math classes - you'll get used to it and learn to <3 it <---- that's a heart. I know the cool lingo. 
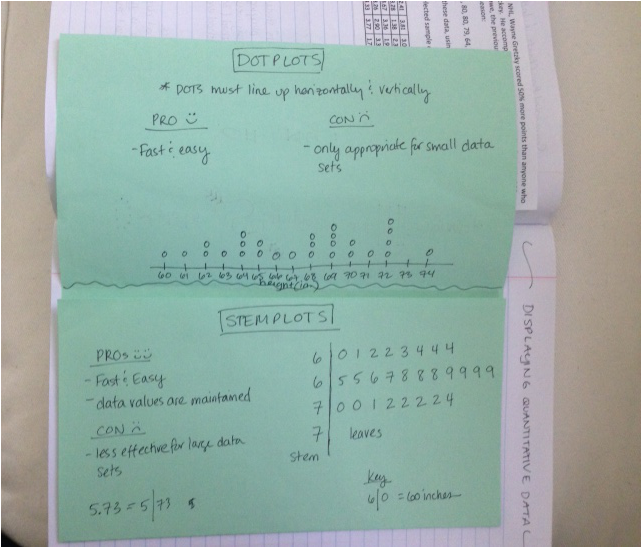
Today we learned how to CUSS! Don't worry, that just means that we learned about describing quantitative distributions by summarizing the CENTER, UNUSUAL FEATURES, the SHAPE, and the SPREAD. Well, we began to CUSS, we really only got to CUS, which just isn't as cool at all, I know. First though, we reviewed the homework, which was to complete the split stem stemplot (say that 5 times fast) on page 11 of your ISN. Answers are here and sideways: 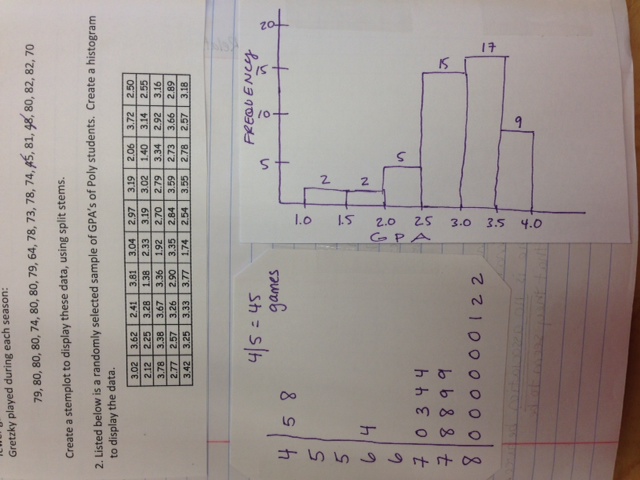 We then began CUSSING! Here's what we've completed of our foldable so far: 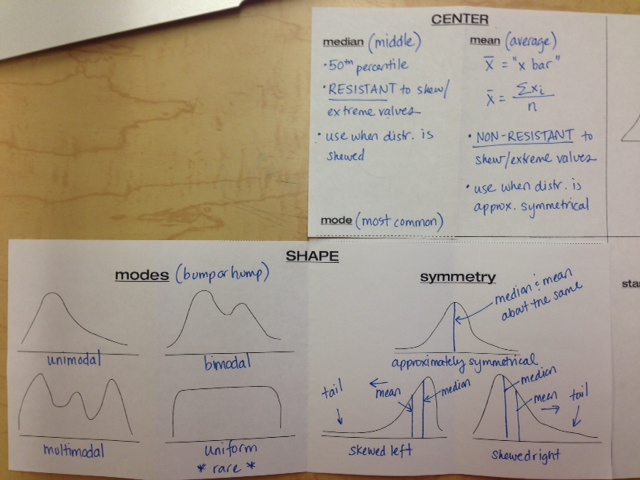 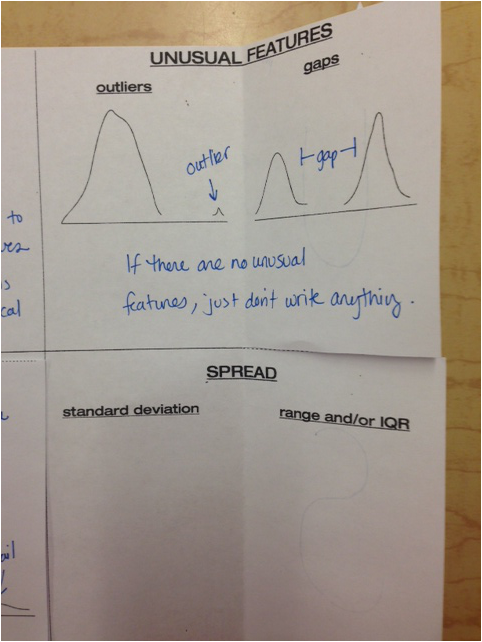 Tomorrow we'll finish up by talking about appropriate measures of spread, and then we'll start practicing like crazy! So much CUSSING to do, so little time! There's no homework tonight. If you'd like a blank copy of the foldable, it is embedded below. We spent a day making sure that we all feel comfortable creating a histogram by hand, and then creating one with the TI-83/84. If you have an nSpire and are unsure of how to make a histogram, see me after school! The TI-nSpire is my JAM! (That's a thing kids say, right?) The calculator directions are embedded below, along with the practice problems that are to be completed on page 11 of your ISN. We are now done with categorical data until the Chapter 1 test . . . and then we're done with it until March! Now onto the much more exciting world of quantitative data! We're starting pretty simply with creating dotplots and stemplots from your class's height data. A picture of the foldable on page 12 is below - we created it by folding a legal size paper into thirds. Histograms on the rest of the foldable tomorrow! 
I hope that everyone had a wonderful Labor Day weekend! Today we reviewed two of our homework assignments in detail, and then we worked on creating a graphical display for Titanic passengers' class and survival and then analyzed what that display told us about the association between class and survival on the Titanic. You have a quiz tomorrow on Learning Topics #1-4 (listed on page 1 of your ISN, and "covered" on pages 3-10) and I will be collecting and checking your notebooks as well tomorrow.
Some main points to keep in mind:
|
AuthorMrs. Secor teaches Pre Calculus and AP Statistics at the Baltimore Polytechnic Institute. Archives
February 2015
Categories |
 RSS Feed
