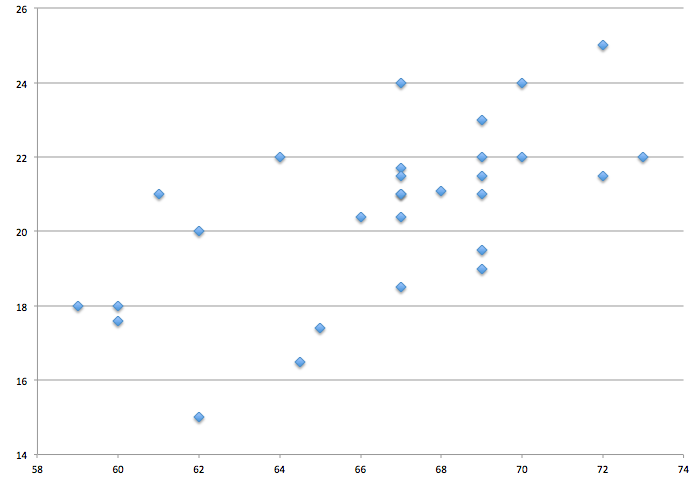
So far we've discussed the idea of "strength" of a linear association pretty vaguely. Today, we're quantifying the strength of the LINEAR association between two variables by calculating r, the correlation. First, we looked at the association between students' heights (inches) and handspans (cm). Here is the scatterplot of that data that we created in Period 6:
We then converted all heights and handspans to z-scores and constructed that scatterplot:
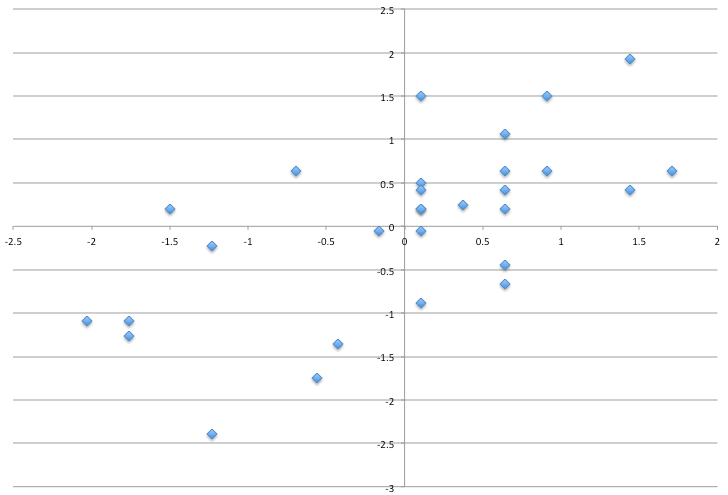
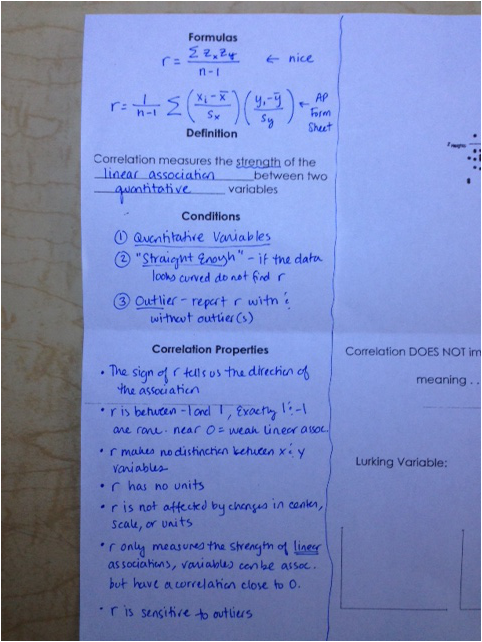
Notice that the form, direction, and strength of these scatterplots are the same - just the axes/scale have changed. We discussed that points in the first and third quadrant are indicating a positive association, and points in the second and fourth quadrant suggest a negative association. We multiplied each person's z-scores and then found the "averages" (we divided by n-1 rather than n, just as we did when calculating the standard deviation). This average is the correlation, r. It is also the slope of the line of best fit for the z-scores, but we'll come back to that in a week or so. After discussing our data, we formalized what we had determined about correlation by taking the following notes:
Here is a blank copy of the foldable:
And here is a copy of the homework that is Due THURSDAY, October 16th. Ignore the due date and LT #'s that are on the document.
 RSS Feed
