We started Chapter 3 today! Chapter 3 is called "Describing Relationships" because we'll be analyzing the relationship between two quantitative variables (bivariate data).
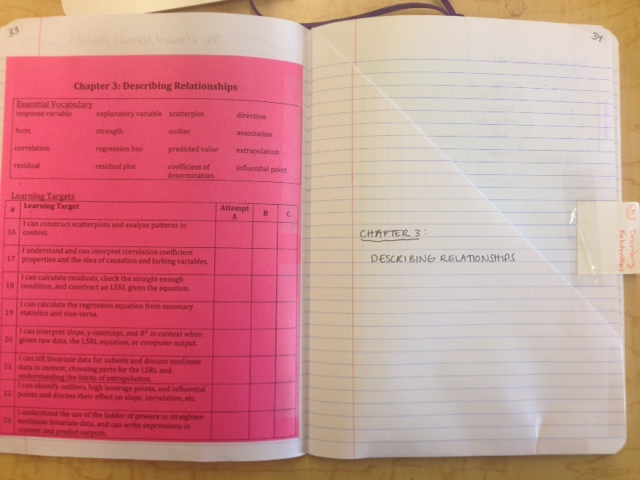
And here is a blank copy of the Chapter 3 Overview for your convenience:
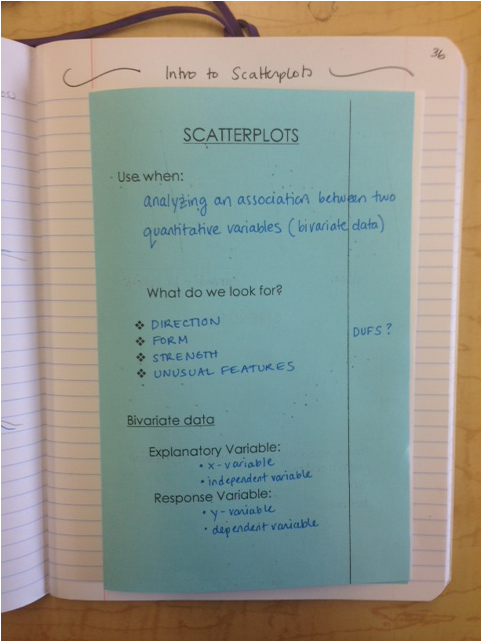
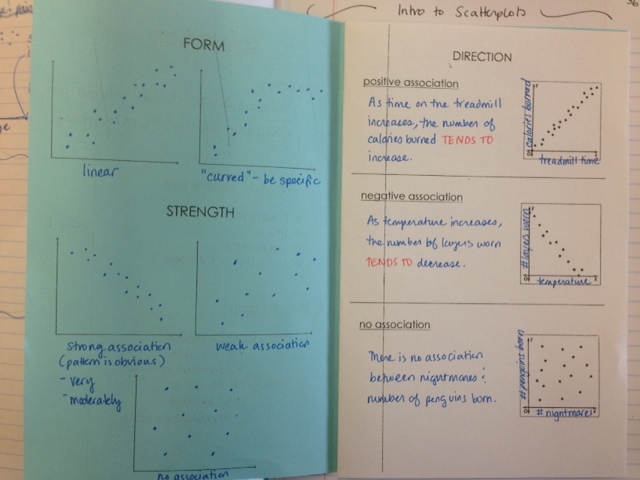
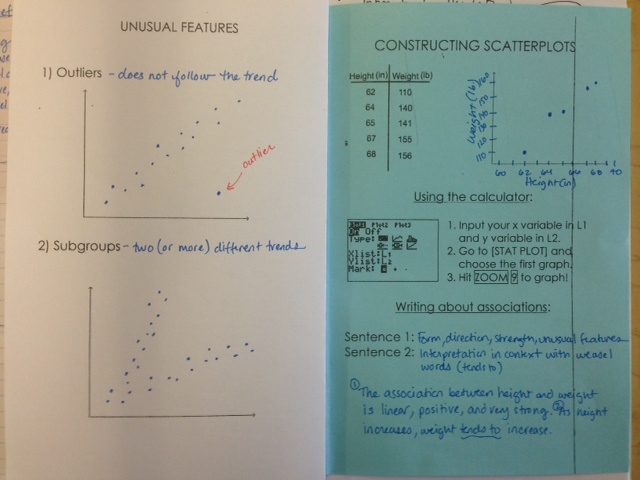
We then created a foldable that shows us how to construct a scatterplot by hand and with the calculator, and how to analyze patterns that we see in the scatterplot by discussing the form, direction, strength, and unusual features in the association.
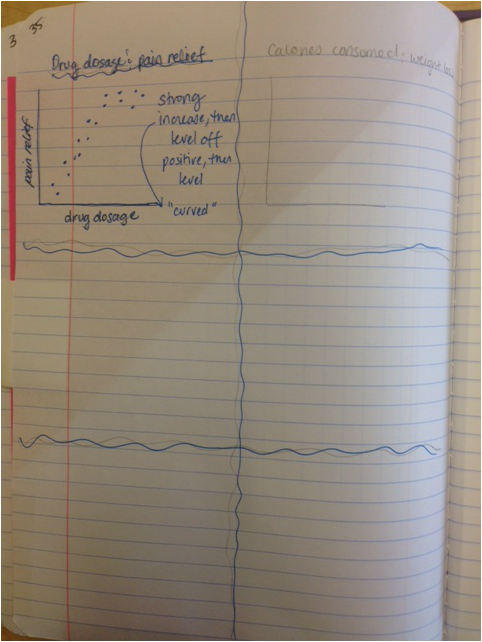
Finally, we started predicting what scatterplots would look like based on the given explanatory and response variable. In class, we reviewed "drug dosage and pain relief" as a whole group and put our sketch of the scatterplot and a brief analysis of form, direction and strength on page 35 of our ISN's.
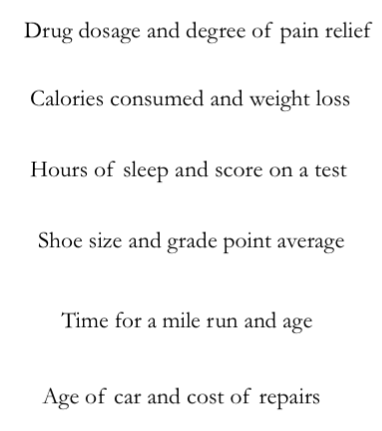
Your homework is to complete the five other scatterplot predictions.
Have a wonderful weekend!!
 RSS Feed
